On this page
Hi everyone 👋, I'm Hung Anh.
At some point in your career, you will run into C4 diagrams inside a Software Architecture Document (SAD) written by a Solution Architect. But do you really understand what each of those diagrams means, and when to use which? And if you were asked to draw the architecture of a system today, could you?
In this article, let's break down the C4 model — one of the most widely used approaches to architecture diagrams — so that next time you can not only read those diagrams, but draw them yourself.
Let's get started.
1. The Problem With Non-Standard Diagrams
Here is a diagram you have probably seen a hundred times:
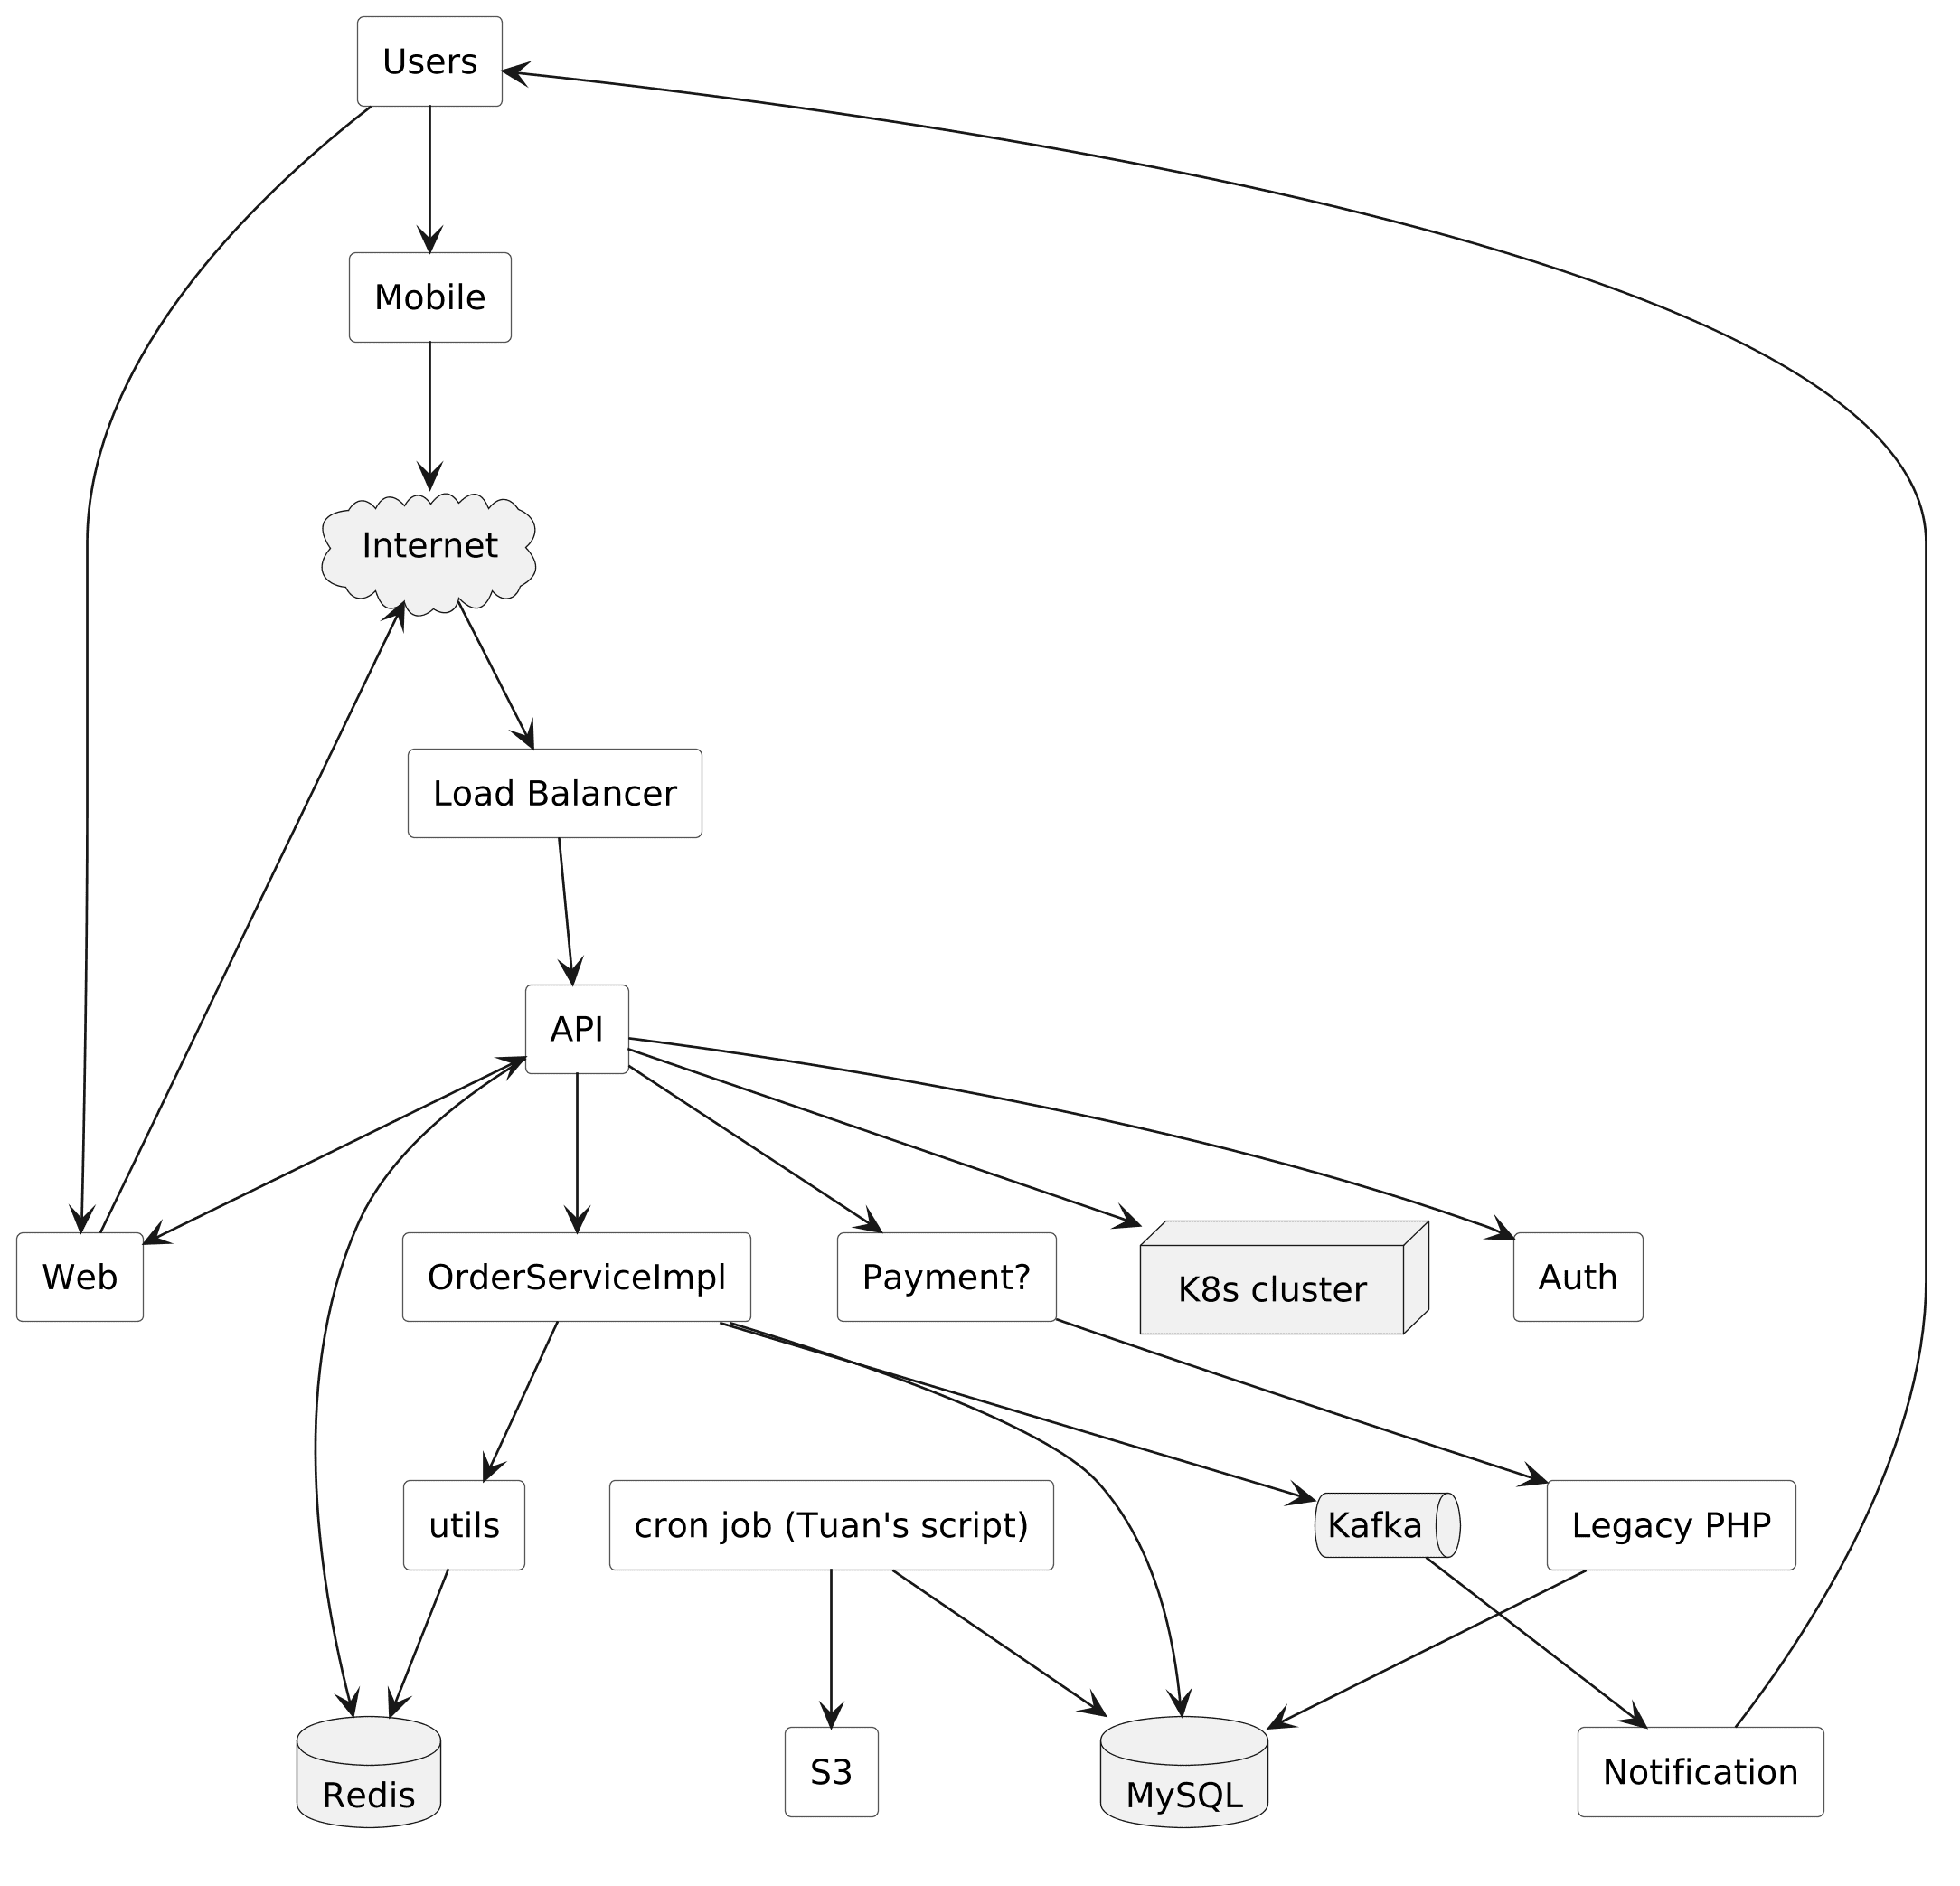
Three problems stand out:
- Mixed abstraction levels. "Users" (people), "OrderServiceImpl" (a Java class), and "K8s cluster" (infrastructure) sit in one picture as if they were the same kind of thing.
- Made-up notation. Does the arrow from "API" to "Auth" mean calls, depends on, or deploys to? Why is one box a cloud and another a cylinder? There is no legend, so every reader guesses.
- One diagram for every audience. A CTO, a new developer, and an SRE need very different levels of detail. One diagram cannot serve all of them — so it ends up serving none.
2. The C4 Model
The C4 model is a standard for describing software architecture at several levels of detail, created by Simon Brown. The idea behind it is familiar: zoom levels on a map. Google Maps shows the same territory as a country, a city, or a single street — each zoom level hides the details that don't matter at that height.
For software, C4 defines four zoom levels: Context, Containers, Components, Code. And one principle behind them: agree on the abstractions first, argue about notation later.
2.1. Core Abstractions
A software system is made up of containers; each container contains components; components are implemented by code.
- Person — a human user: customer, admin, operator.
- Software System — the highest level: something that delivers value to its users. Your system is one; the payment gateway you call is another.
- Container — a separately deployable unit: a backend API, a SPA, a mobile app, a database. If it needs its own process or its own deployment, it's a container.
- Component — a group of related functionality inside a container: a service, a controller, a repository. Components are not deployable on their own — they live inside their container's process.
C4 predates Docker. A C4 container is anything separately runnable or deployable — a Spring Boot service is one container whether it runs in Docker or on a VM.
2.2. The Levels of the C4 Model
Running example: FoodGo, a food delivery platform. Customers order food from local restaurants, restaurants manage their own menu and incoming orders, shippers pick up and deliver the orders, and payments go through an external payment provider.
2.2.1. Level 1: System Context
Level 1 describes: what the system is, who uses it, and what it talks to.
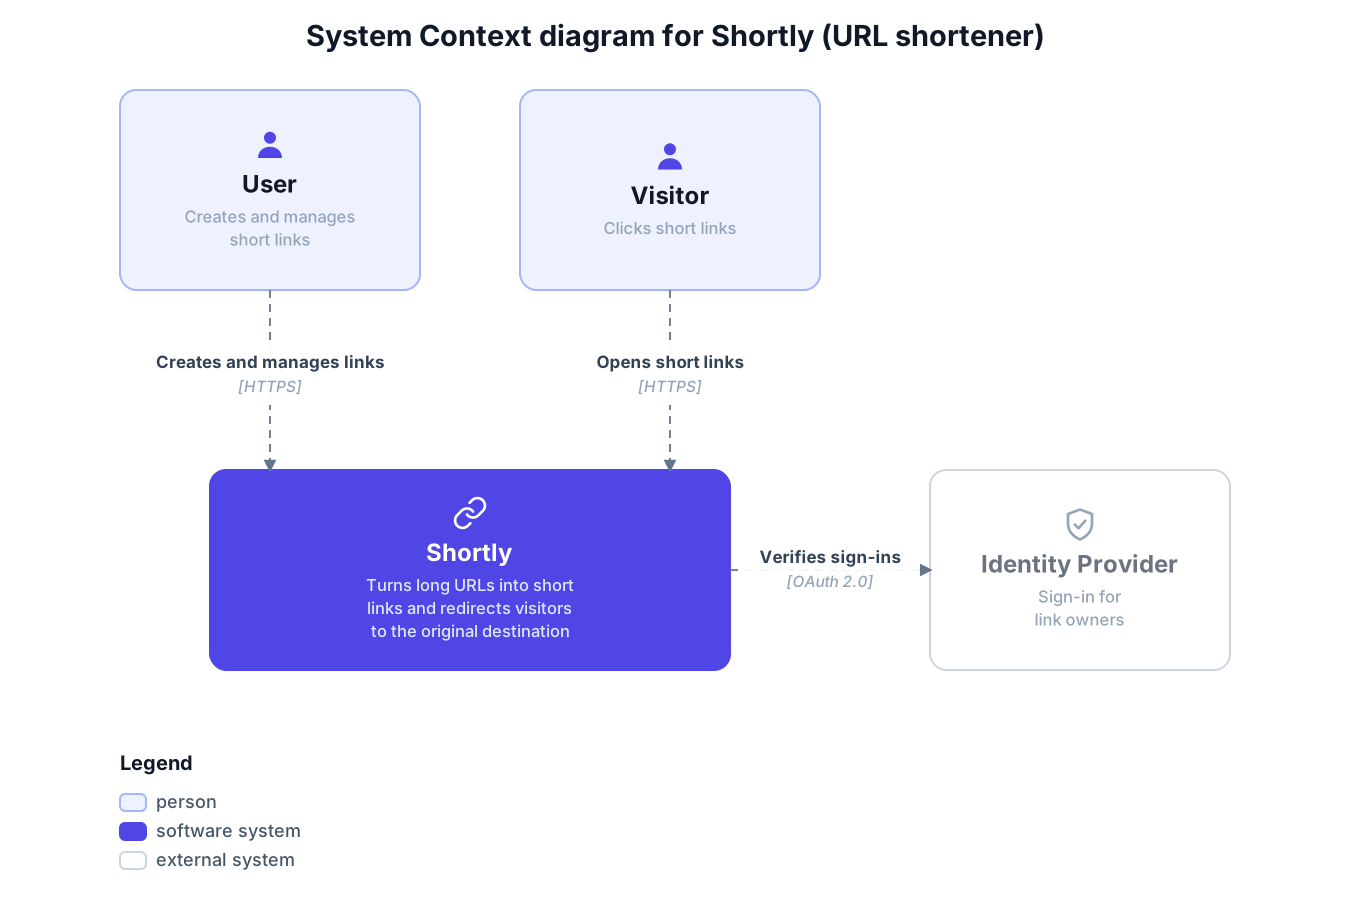
No database, no cache, no internals — the whole system is one box. This is the diagram everyone can read, including non-technical people, and the one that changes least. Whatever system you build, draw this one first.
2.2.2. Level 2: Container
Level 2 describes: the big technical blocks and how they communicate.
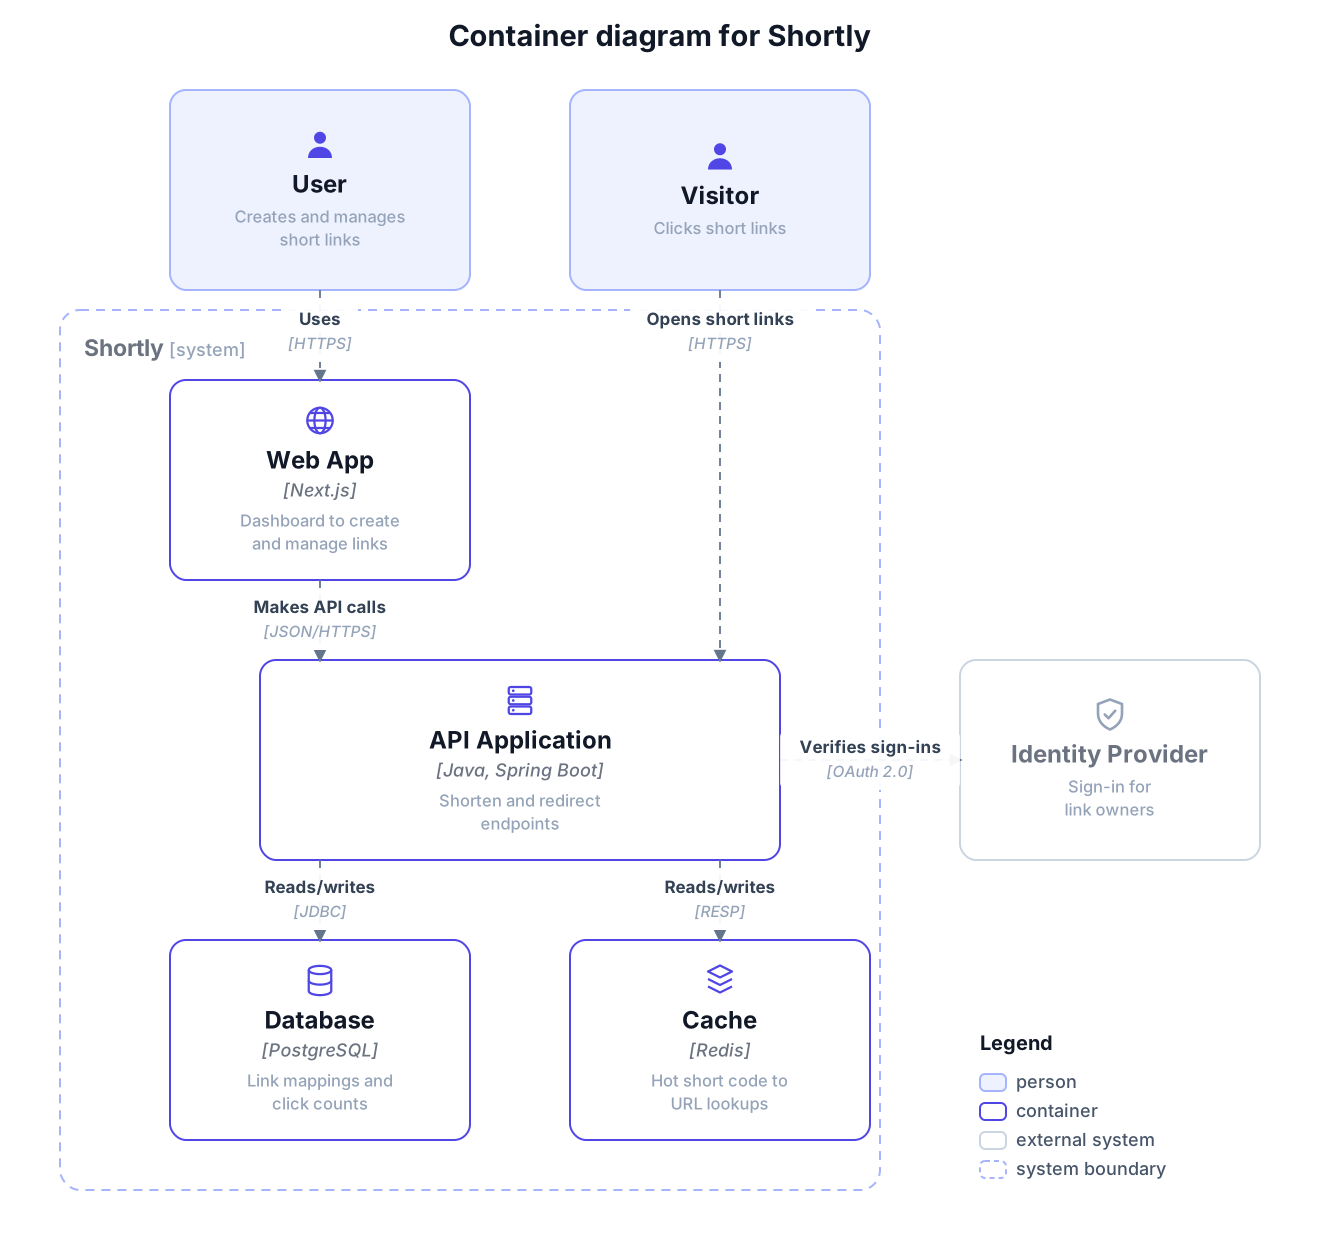
The system now splits into its big technical blocks: a single mobile app shared by customers and shippers, a separate Restaurant Portal web app for restaurant owners, a Spring Boot API, PostgreSQL, and Kafka.
Two choices in this picture are deliberate. Restaurants get their own web app because their workflow — managing a menu, watching orders come in — happens at a desk in a browser, not on a phone. And Kafka isn't decoration: the API only publishes order events, while a separate Notification Worker consumes them and sends the push/SMS — so placing an order never waits for a notification to go out. Note also that every container is annotated with its technology, every arrow has a verb and a protocol, and the line style carries meaning too: solid arrows are synchronous calls, dashed ones are asynchronous messages through Kafka. Both are explained in the legend.
For most systems, Context + Container are all the architecture diagrams you need. If you run dozens of microservices, don't force them into one giant picture — draw one diagram per service with its direct neighbors.
2.2.3. Level 3: Component
Level 3 describes: what is inside one container.
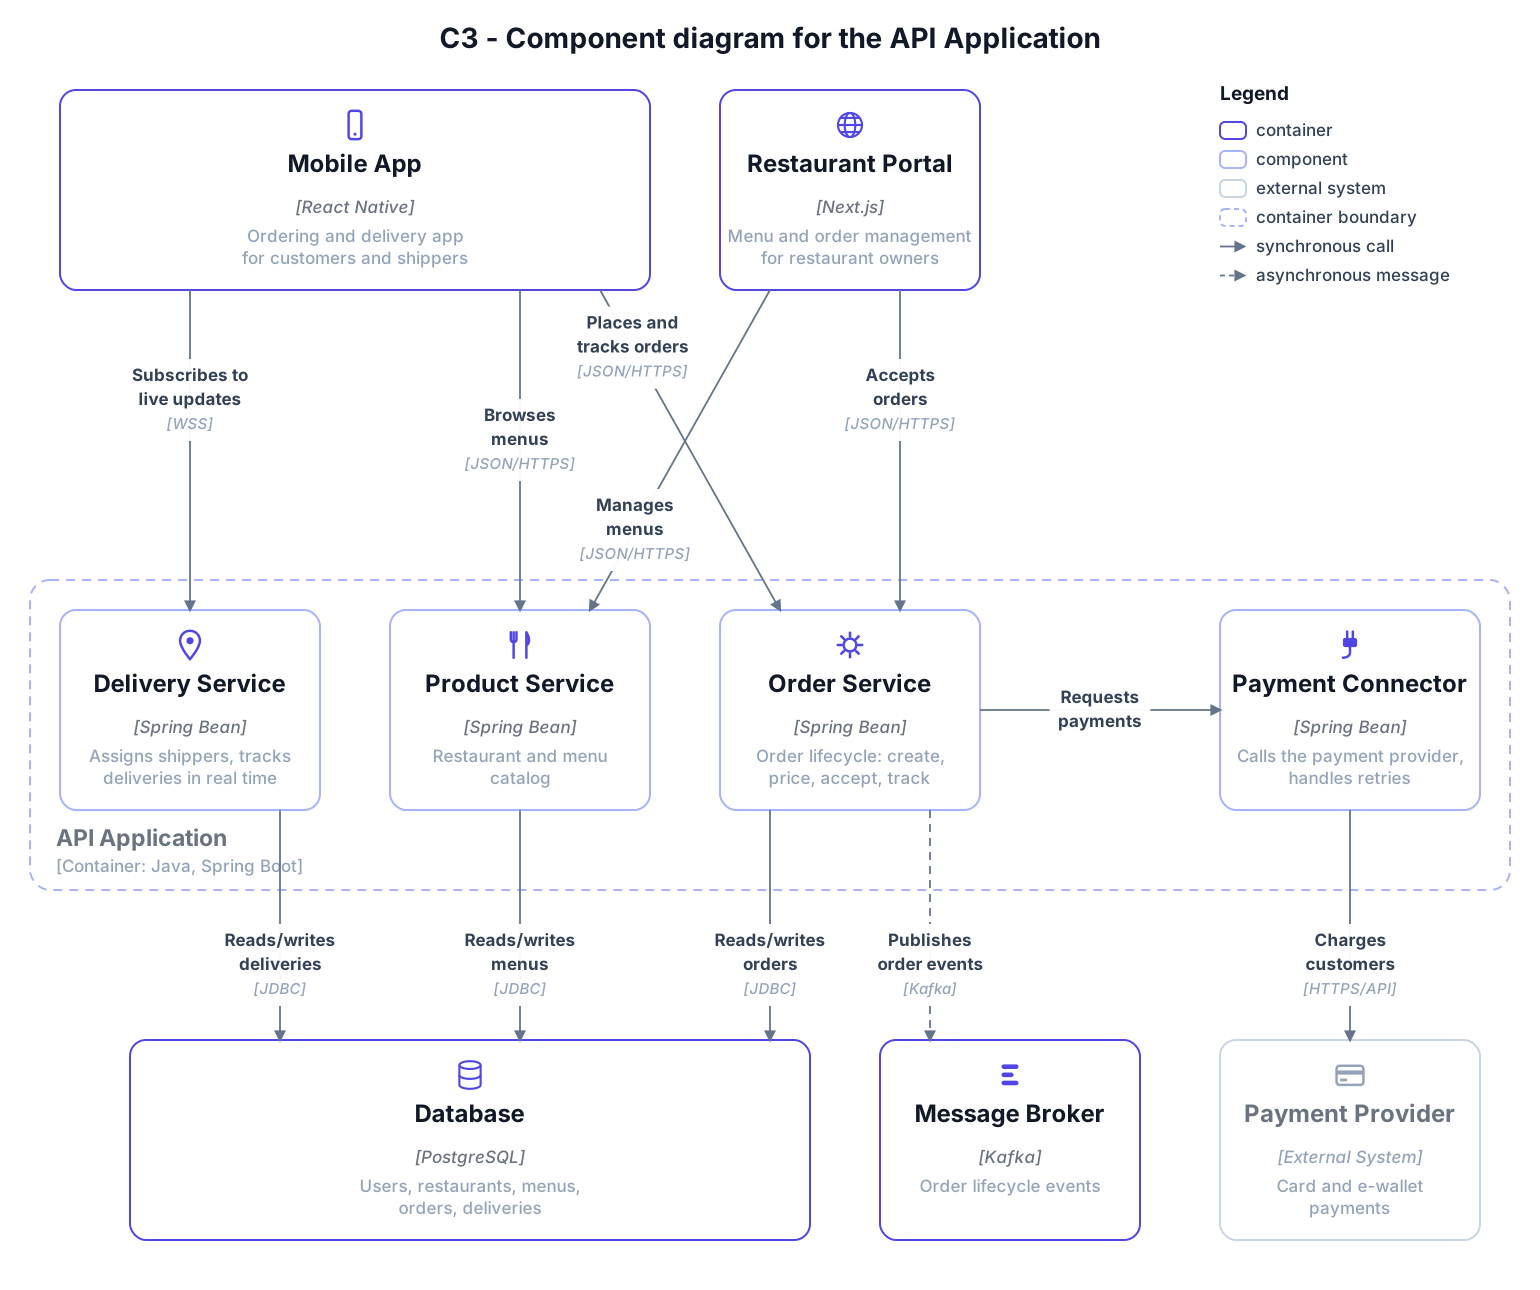
Inside the API Application sit familiar building blocks: a Product Service for the restaurant and menu catalog (the Mobile App calls it to browse, the Restaurant Portal to manage), an Order Service for the order lifecycle (the Mobile App places and tracks orders, the Restaurant Portal accepts them), a Delivery Service that assigns shippers and streams live delivery updates, and a Payment Connector that the Order Service uses to talk to the payment gateway. The three services read and write the application's shared database, each touching its own slice of the data. Each component maps to a package or module in the code — not to concrete classes; that is Level 4's job.
Two details in this picture are easy to miss. First, the dashed frame now wraps only the API Application: the Database, the Message Broker and the Payment Provider sit outside it, and so do the Mobile App and the Restaurant Portal, drawn as the containers they are — unlike C2, where the frame wraps all of FoodGo. Second, every arrow that left the API Application in C2 now has a concrete owner: the Order Service is the component that publishes order events to Kafka, and the Payment Connector is the one that charges customers. The levels have to agree with each other — if C2 shows the API talking to Kafka, C3 must show which component does it. This is also why C3 is not a "services diagram": services are separately deployable, so they live at C2; C3 shows the modules inside a single codebase. In a microservices system, every service appears at C2, and C3 zooms into one service at a time.
Only draw component diagrams where they add real value: they change more often than the levels above, so they go stale the fastest. Many teams skip them or generate them from code.
2.2.4. Level 4: Code
Class diagrams of individual components. Don't draw these by hand — your IDE can generate them on demand, and at this zoom level the code itself is the source of truth.
C4 also defines three supplementary diagrams: System Landscape (all systems in your organization), Dynamic (how elements collaborate at runtime, with numbered steps), and Deployment (which containers run on which infrastructure).
2.3. Recap
| Level | Question it answers | Audience | Changes |
|---|---|---|---|
| 1. Context | What is it? Who uses it? | Everyone | Rarely |
| 2. Container | What are the big blocks? | All technical people | Occasionally |
| 3. Component | What's inside a container? | The container's developers | Often |
| 4. Code | How is it implemented? | Developers, on demand | Constantly |
The pattern: the deeper the zoom, the narrower the audience and the faster the diagram rots. That's why you rarely need all four levels.
2.4. Rules and Common Mistakes to Avoid
C4 doesn't dictate shapes or colors, but every good diagram follows the same rules:
- A title: diagram type + scope ("Container diagram for FoodGo").
- A legend — every shape, color, and line style means something.
- Every element carries its type and a short description of its responsibility.
- Technology choices written down:
[Java, Spring Boot],[PostgreSQL]. - Every arrow is one-way and labeled with a specific verb — plus the protocol when the arrow crosses a process boundary. Avoid the word "uses", and avoid vague verbs like "makes API calls".
- The levels agree with each other: a person or arrow that appears at C1 shows up again at C2, and every arrow leaving a container at C2 has a component that owns it at C3.
Here are a few common mistakes when drawing C4 diagrams:
- Inventing levels that don't exist in the model ("sub-components", "sub-containers").
- Drawing the internals of systems you don't own.
- Mixing several zoom levels in one picture — e.g. a class next to a container, or a database table next to a software system.
- Cramming too many elements into one picture.
One thing to keep in mind: the four core C4 diagrams describe static structure only — for runtime behavior you need a Dynamic diagram or a sequence diagram, and for data models an ER diagram. And for a small team with a single service, a Context diagram plus a good README may be enough. C4 shows its value when many people need to share the same picture of the system.
3. Summary
- C4 = four zoom levels: Context, Containers, Components, Code — each answering one question for one audience.
- A C4 container is anything separately deployable — not a Docker container.
- Context + Container is the sweet spot. Draw Components only where they pay off; let the IDE generate Code diagrams.
- Every diagram needs a title, a legend, typed elements, technologies, and labeled one-way arrows.
Next time someone asks you to "draw the architecture", ask back: at which zoom level, and for whom?
See you in the next one. Happy reading! 🍵
References
- The C4 model for visualising software architecture
- The C4 Model for Software Architecture — Simon Brown, InfoQ
- The C4 Model – Misconceptions, Misuses & Mistakes — Simon Brown, GOTO 2024
- Structurizr DSL documentation
- C4-PlantUML
- What is the C4 model? — IcePanel
 Do Hung Anh@anhdh
Related articles
Distributed Locks and How to Implement Them with Redis
In distributed systems, ensuring data consistency and preventing race conditions is a major challenge, especially when many processes or services access shared resources concurrently. A distributed lock is an effective way to handle this problem. In this article, I will help you understand what a distributed lock is, why it is needed, the different ways to implement one, and how to build it with Redis.
Message Broker
Have you ever wondered what keeps payment services, social networks, and delivery apps running smoothly every single day? The secret lies in the Message Broker - the "invisible connector" that moves information safely and efficiently between systems. Let's explore what a Message Broker really is!
CronJob & Cron Expressions
CronJob is an essential tool that lets developers automate tasks on a recurring schedule. To configure a CronJob correctly, however, you need a solid grasp of the Cron Expression - the expression that defines the schedule for your automated jobs. This article introduces CronJob, explains how to build a Cron Expression, and shares some handy tools for creating cron expressions with ease.